Data Science
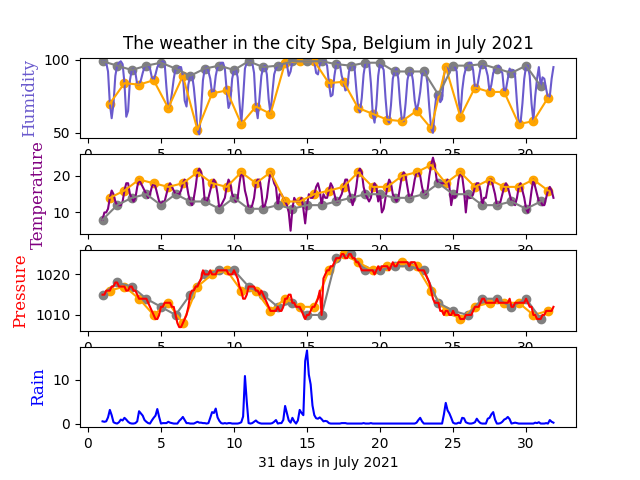
This image shows a result from the Matplotlib Phyton
Library.
It shows the humidity (in %), temperature (in °C), pressure (in mb) and rain (in mm)
for the month July 2021 in the city of Spa measured every 3 hours. The darkgrey bols mark 12am night en
the
orange bols mark 12pm noon.
Data from the worldweatheronline Api Click here to see data file
This video shows a cross country analysis of features that correlate with life expectancy. I uploaded the data from UNdata and NationMaster to Power Bi. The visualisation is made with the Line Chart, Pie Chart, Cards and Correlation Plot Visual
Data Science is a combination of statistics and computing.
Statistical methods allow to gain precise knowledge and insight from data. Nowadays statistical analysis
is
typically done with computers (faster, less mistakes, can deal with big Data). Discovering patterns in
Big
Data is called data mining. Data mining can be for hypothesis validation, knowledge discovery,
descriptive
(focus on correlations) or predictive (focus on predictions). Data can be acquired from APIs, web
scraping,
experiments (2 groups, changing circumstances) or observations.
Data scientists need computer knowledge, namely Database, Machine Learning and the languages Python
(used by 57% of the scientists) or R + libraries. Examples of Python libraries are NumPy for array use,
Pandas for analysing data, SciPy for scientific computing and Matplotlib for graphic plotting.
Artificial Intelligence means simulation of human intelligence (perception, learning, communication,
problem solving,...). AI can be (AI robots) but is not always (industrial robots) built into robots.
Machine
Learning is a step to AI. It means programming computer to use statistics and learn from data.